Explore the Gloo UI
Explore the features of the Gloo UI to help you get an at-a-glance view of your Gloo Gateway environment.
About the Gloo UI
- Gloo Gateway dashboard: Use the Gloo UI dashboard to quickly review the health of your Gloo Gateway setup, and any insights that were detected. If you use the Gloo UI in a multicluster setup, you can also review the health of the Gloo management server and agents.
- Insights: The Gloo UI comes with an insights engine that automatically analyzes your Gloo Gateway setup for health issues. These issues are shared in the UI along with recommendations to harden your Gloo Gateway setup. The insights give you a checklist to address issues that might otherwise be hard to detect across your environment. For more information, see Insights.
- Traffic resource overview: Review the gateways, routes, policies, and destinations that are set up in your environment and the traffic management rules that you applied to them.
- Security and compliance: The Dashboard and Security Insights pages of the Gloo UI can help you review the overall security posture of your setup, including insights and recommendations regarding your certificates, encrypted traffic, FIPS compliance, and more.
- Drill into apps and services: Review what services can communicate with other services and how traffic between services is secured.
- Visualize and monitor metrics: With the built-in Prometheus integration, the Gloo UI has access to workload-specific metrics, such as the number of requests that were received for a workload. This data is visualized in the Gloo UI graph.
Before you begin
Follow the steps to Set up the Gloo UI.
Launch the UI
-
Port-forward the Gloo UI pod.
kubectl port-forward deployment/gloo-mesh-ui -n gloo-system 8090 -
Open the Gloo UI dashboard.
open http://localhost:8090/dashboard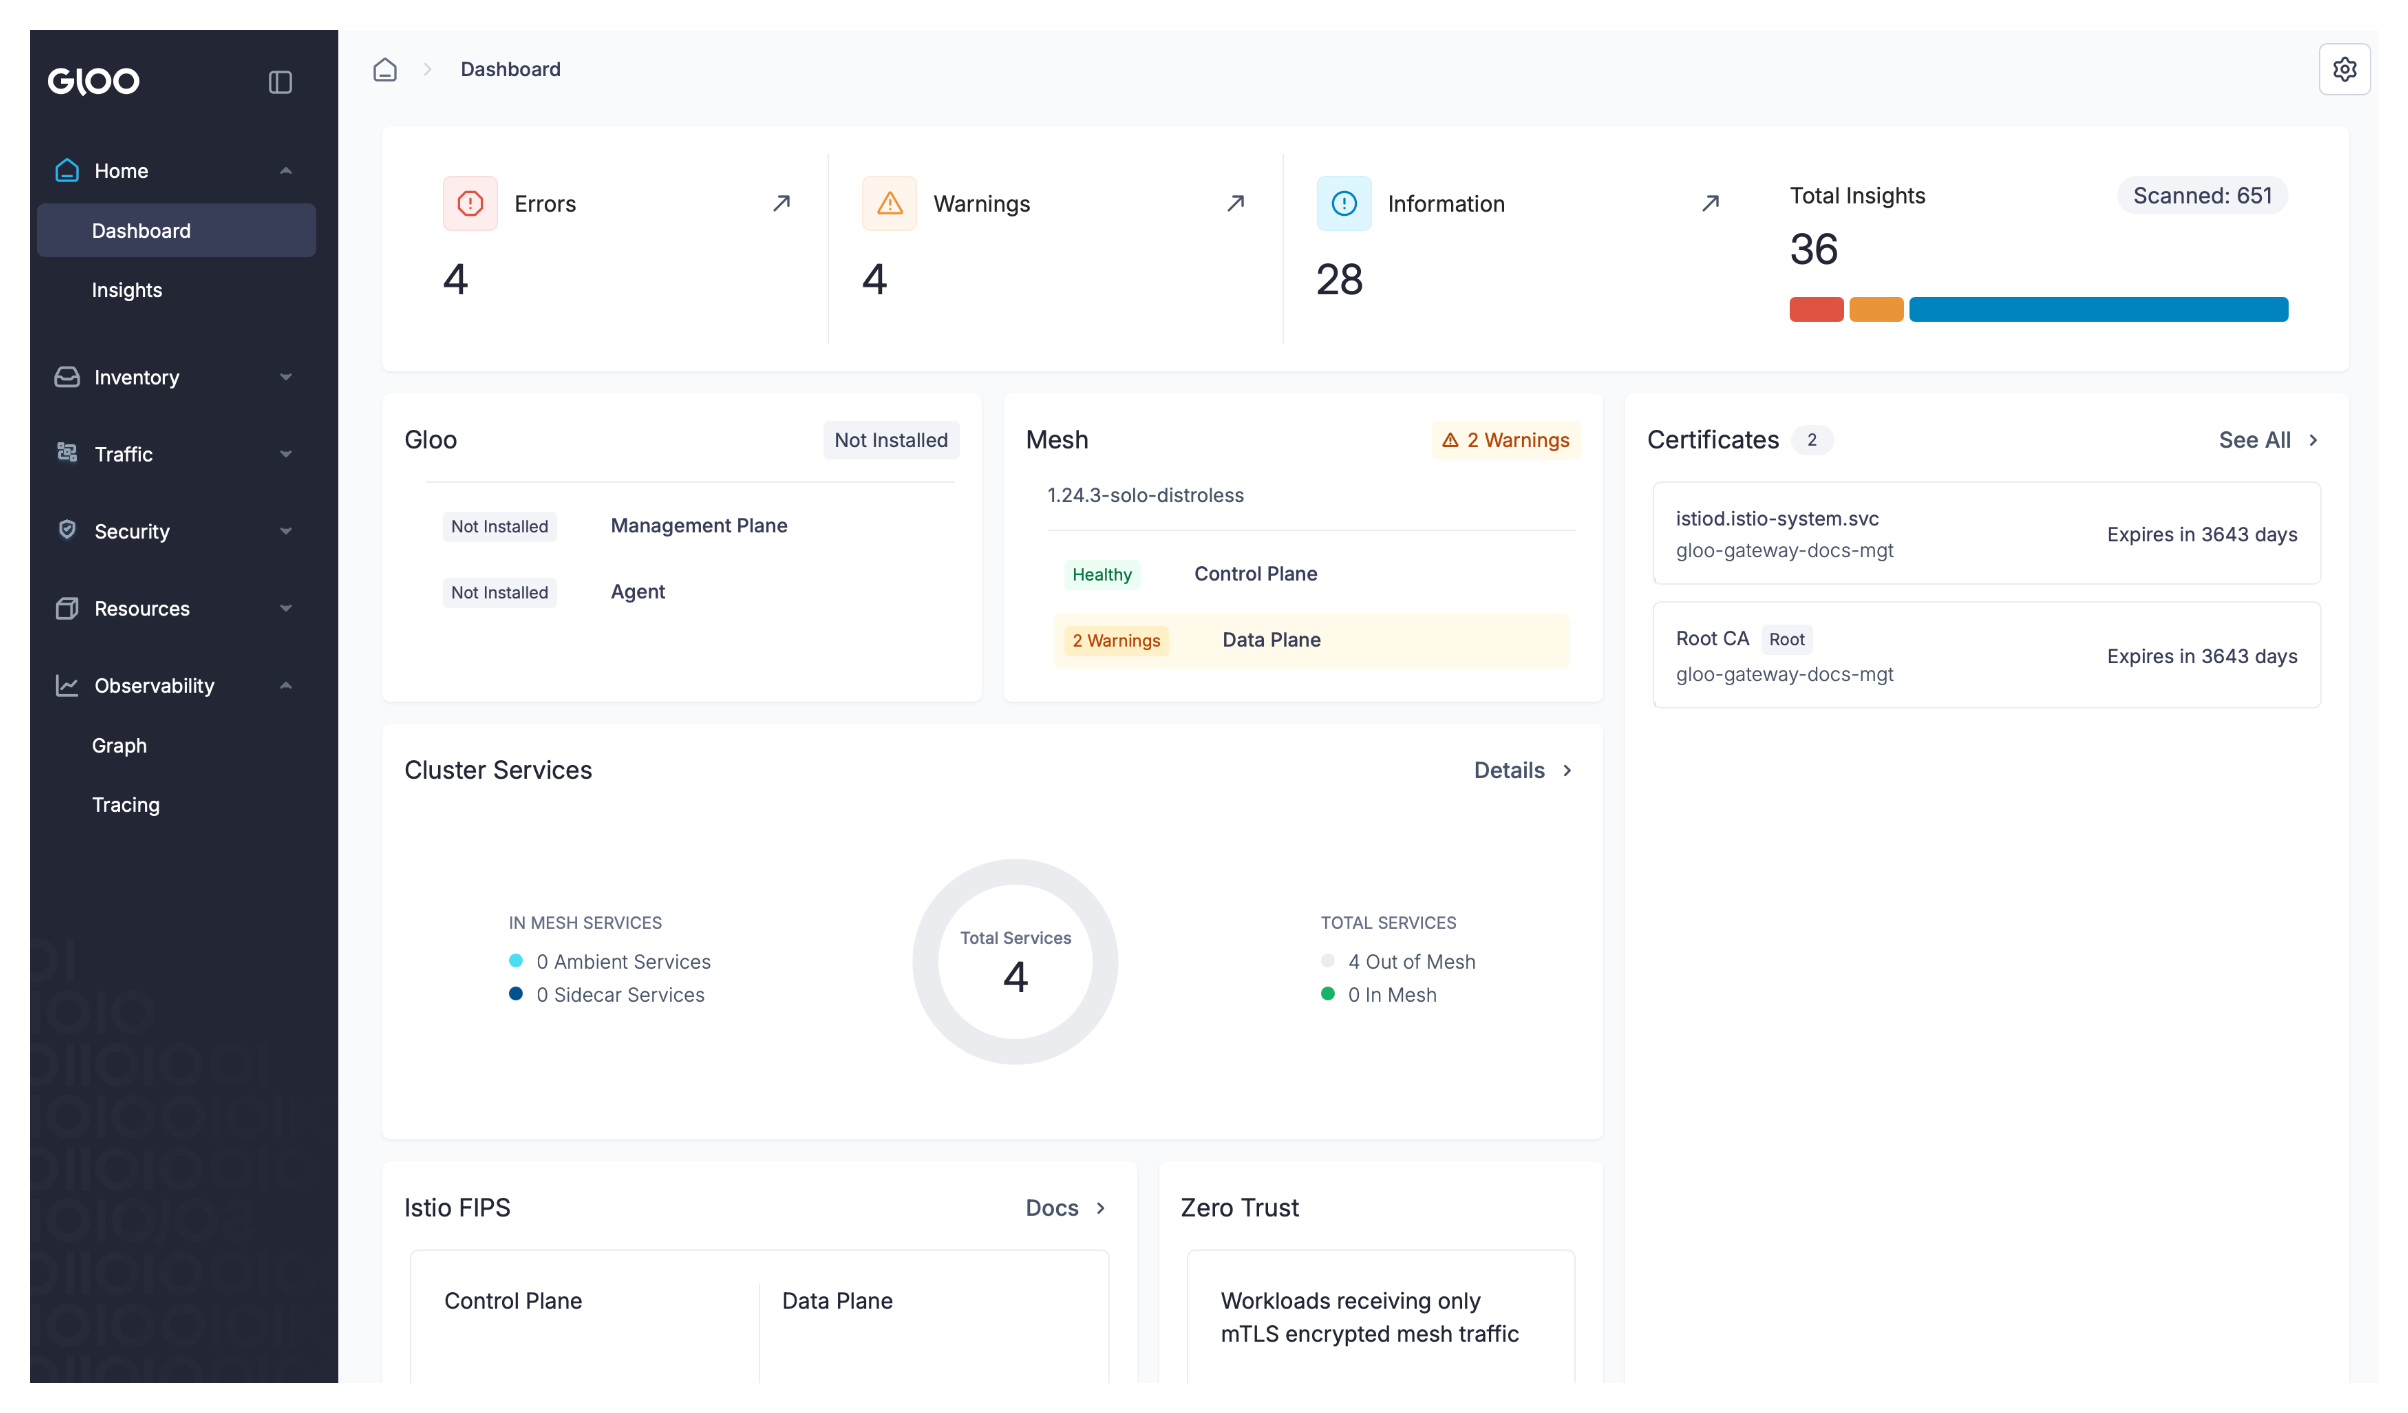
Home
View the health and performance of your Gloo Gateway control and data plane components, and view recommendations to harden your setup by using the Dashboard and Insights pages.
Dashboard
The Gloo UI dashboard provides an at-a-glance overview of your Gloo Gateway setup and the health of your components. If you have gateways that use the Kubernetes Gateway API, you can also view request rates, failures, and request latency on the dashboard. Note the the request rate, failures, and latency is not available when you use gateways that are based on the Gloo Edge API.
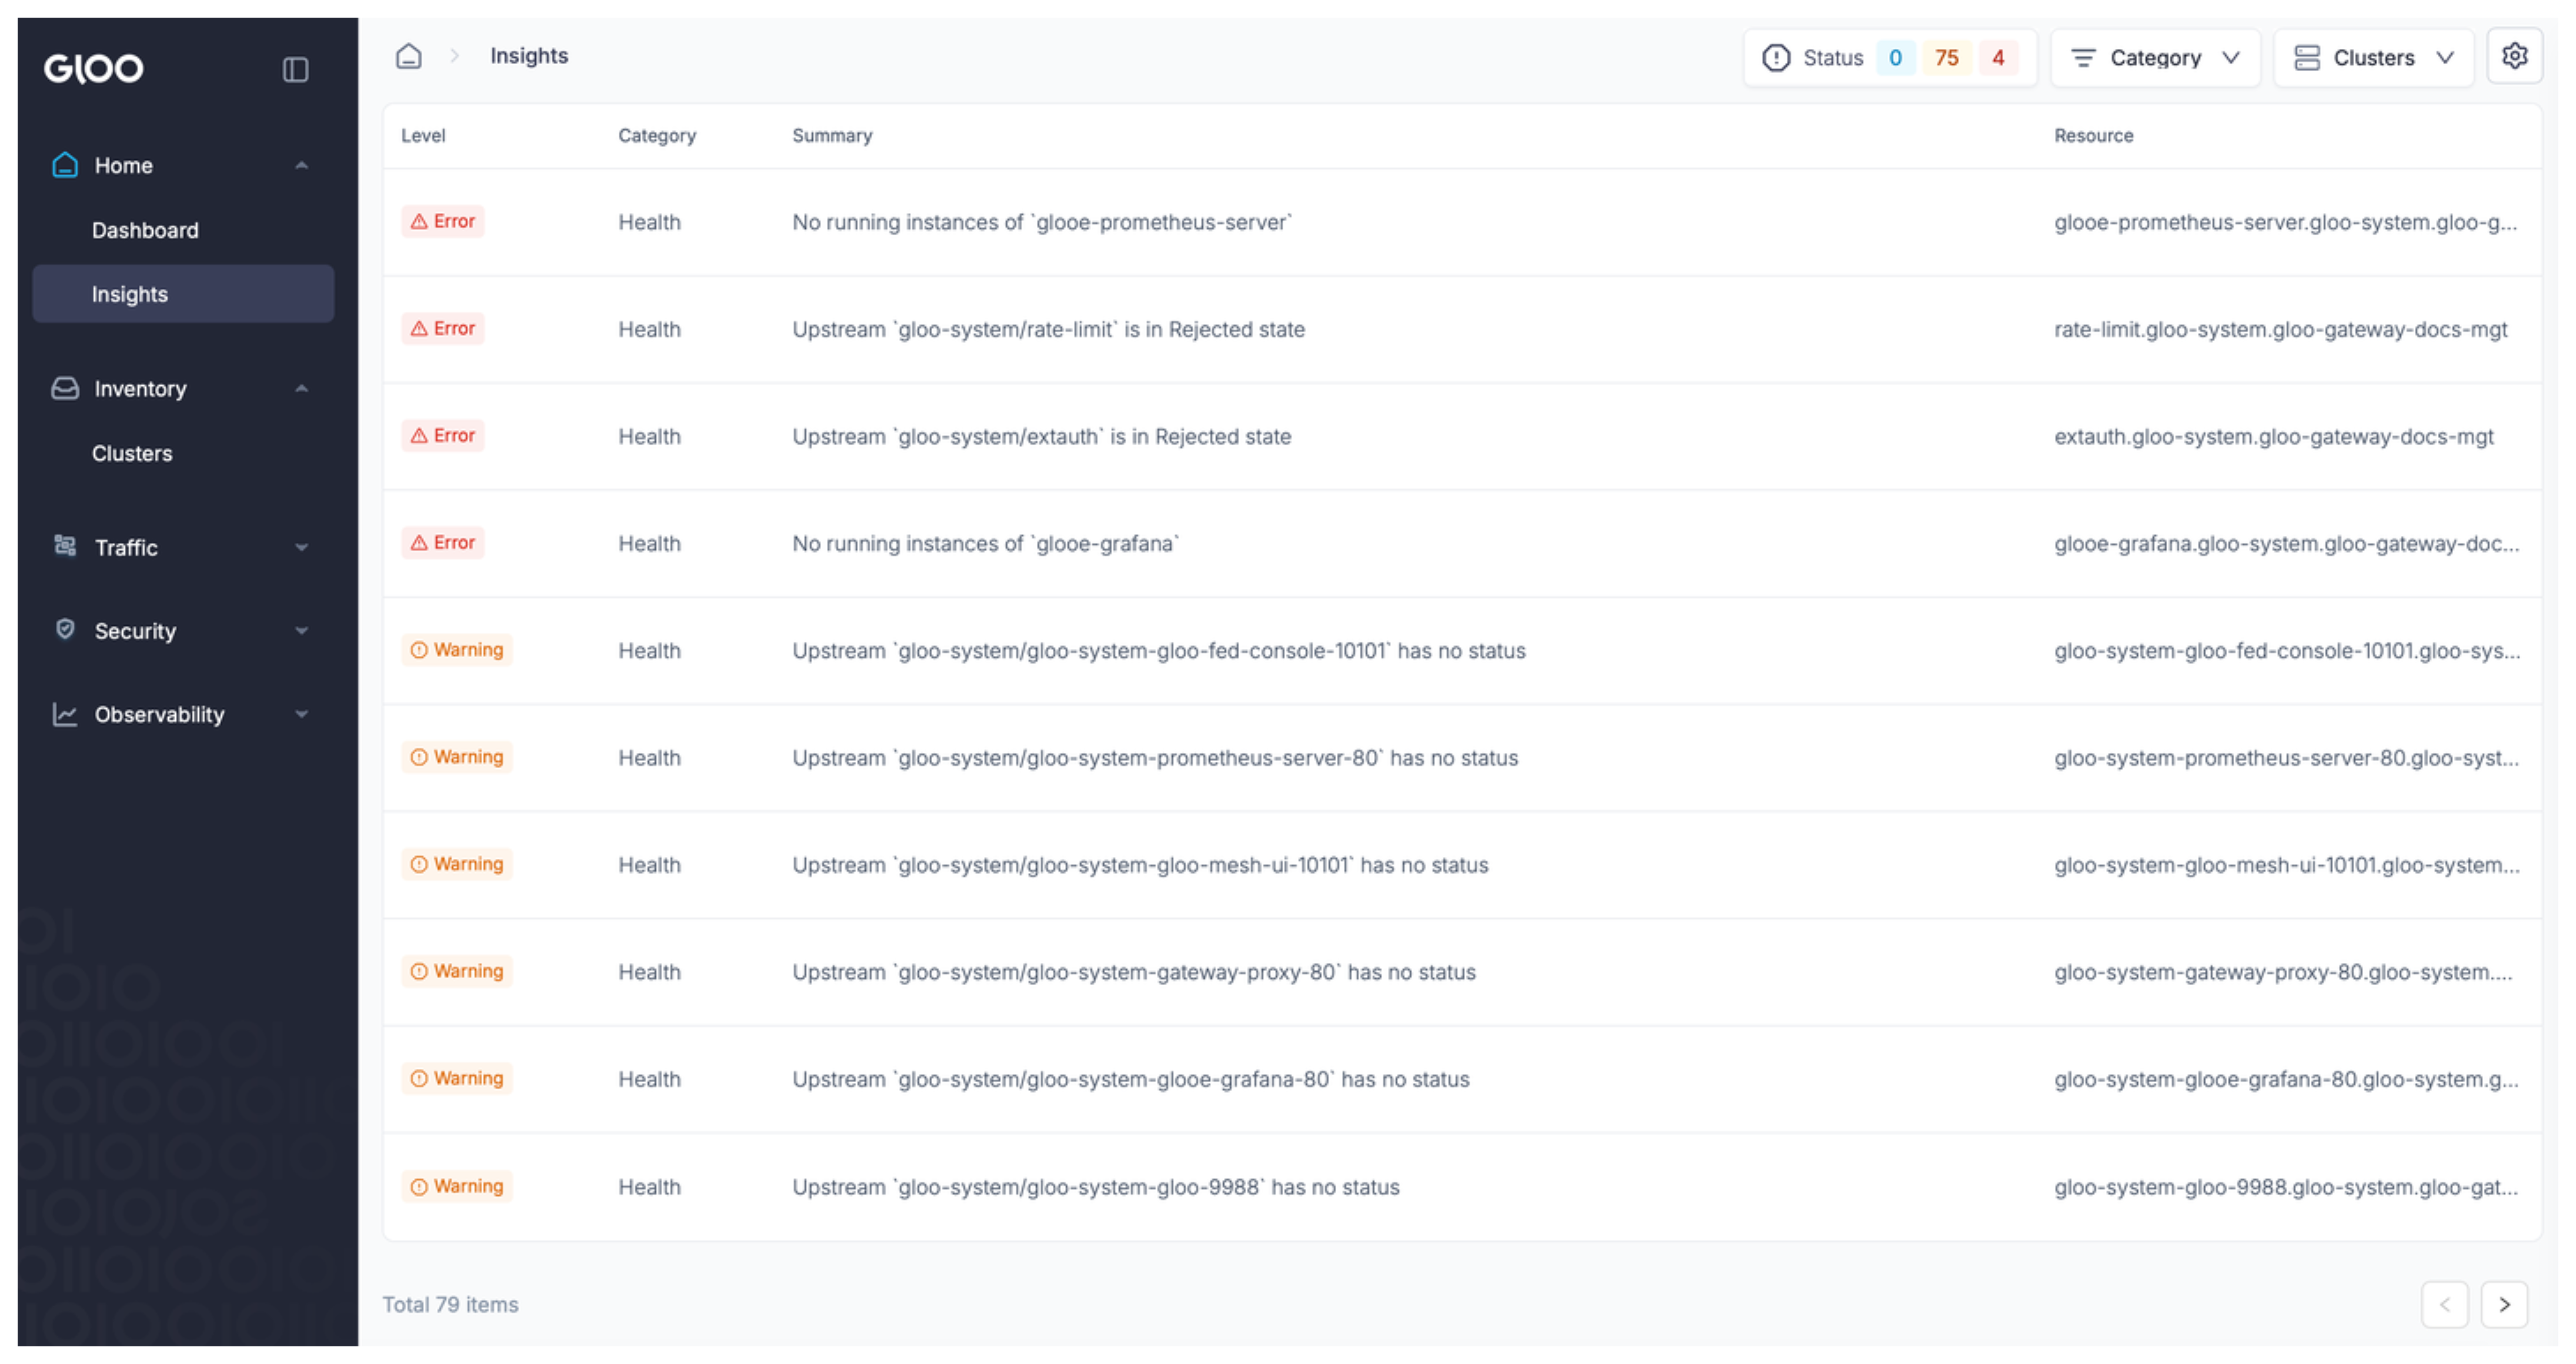
Insights
The Gloo UI comes with an insights engine that automatically analyzes your Gloo Gateway setup for health issues. These issues are displayed in the UI along with recommendations to harden your setups. The insights give you a checklist to address issues that might otherwise be hard to detect across your environment.
Inventory
The Inventory section provides an at-a-glance look at the health of registered clusters and discovered services that make up your Gloo Gateway environment.
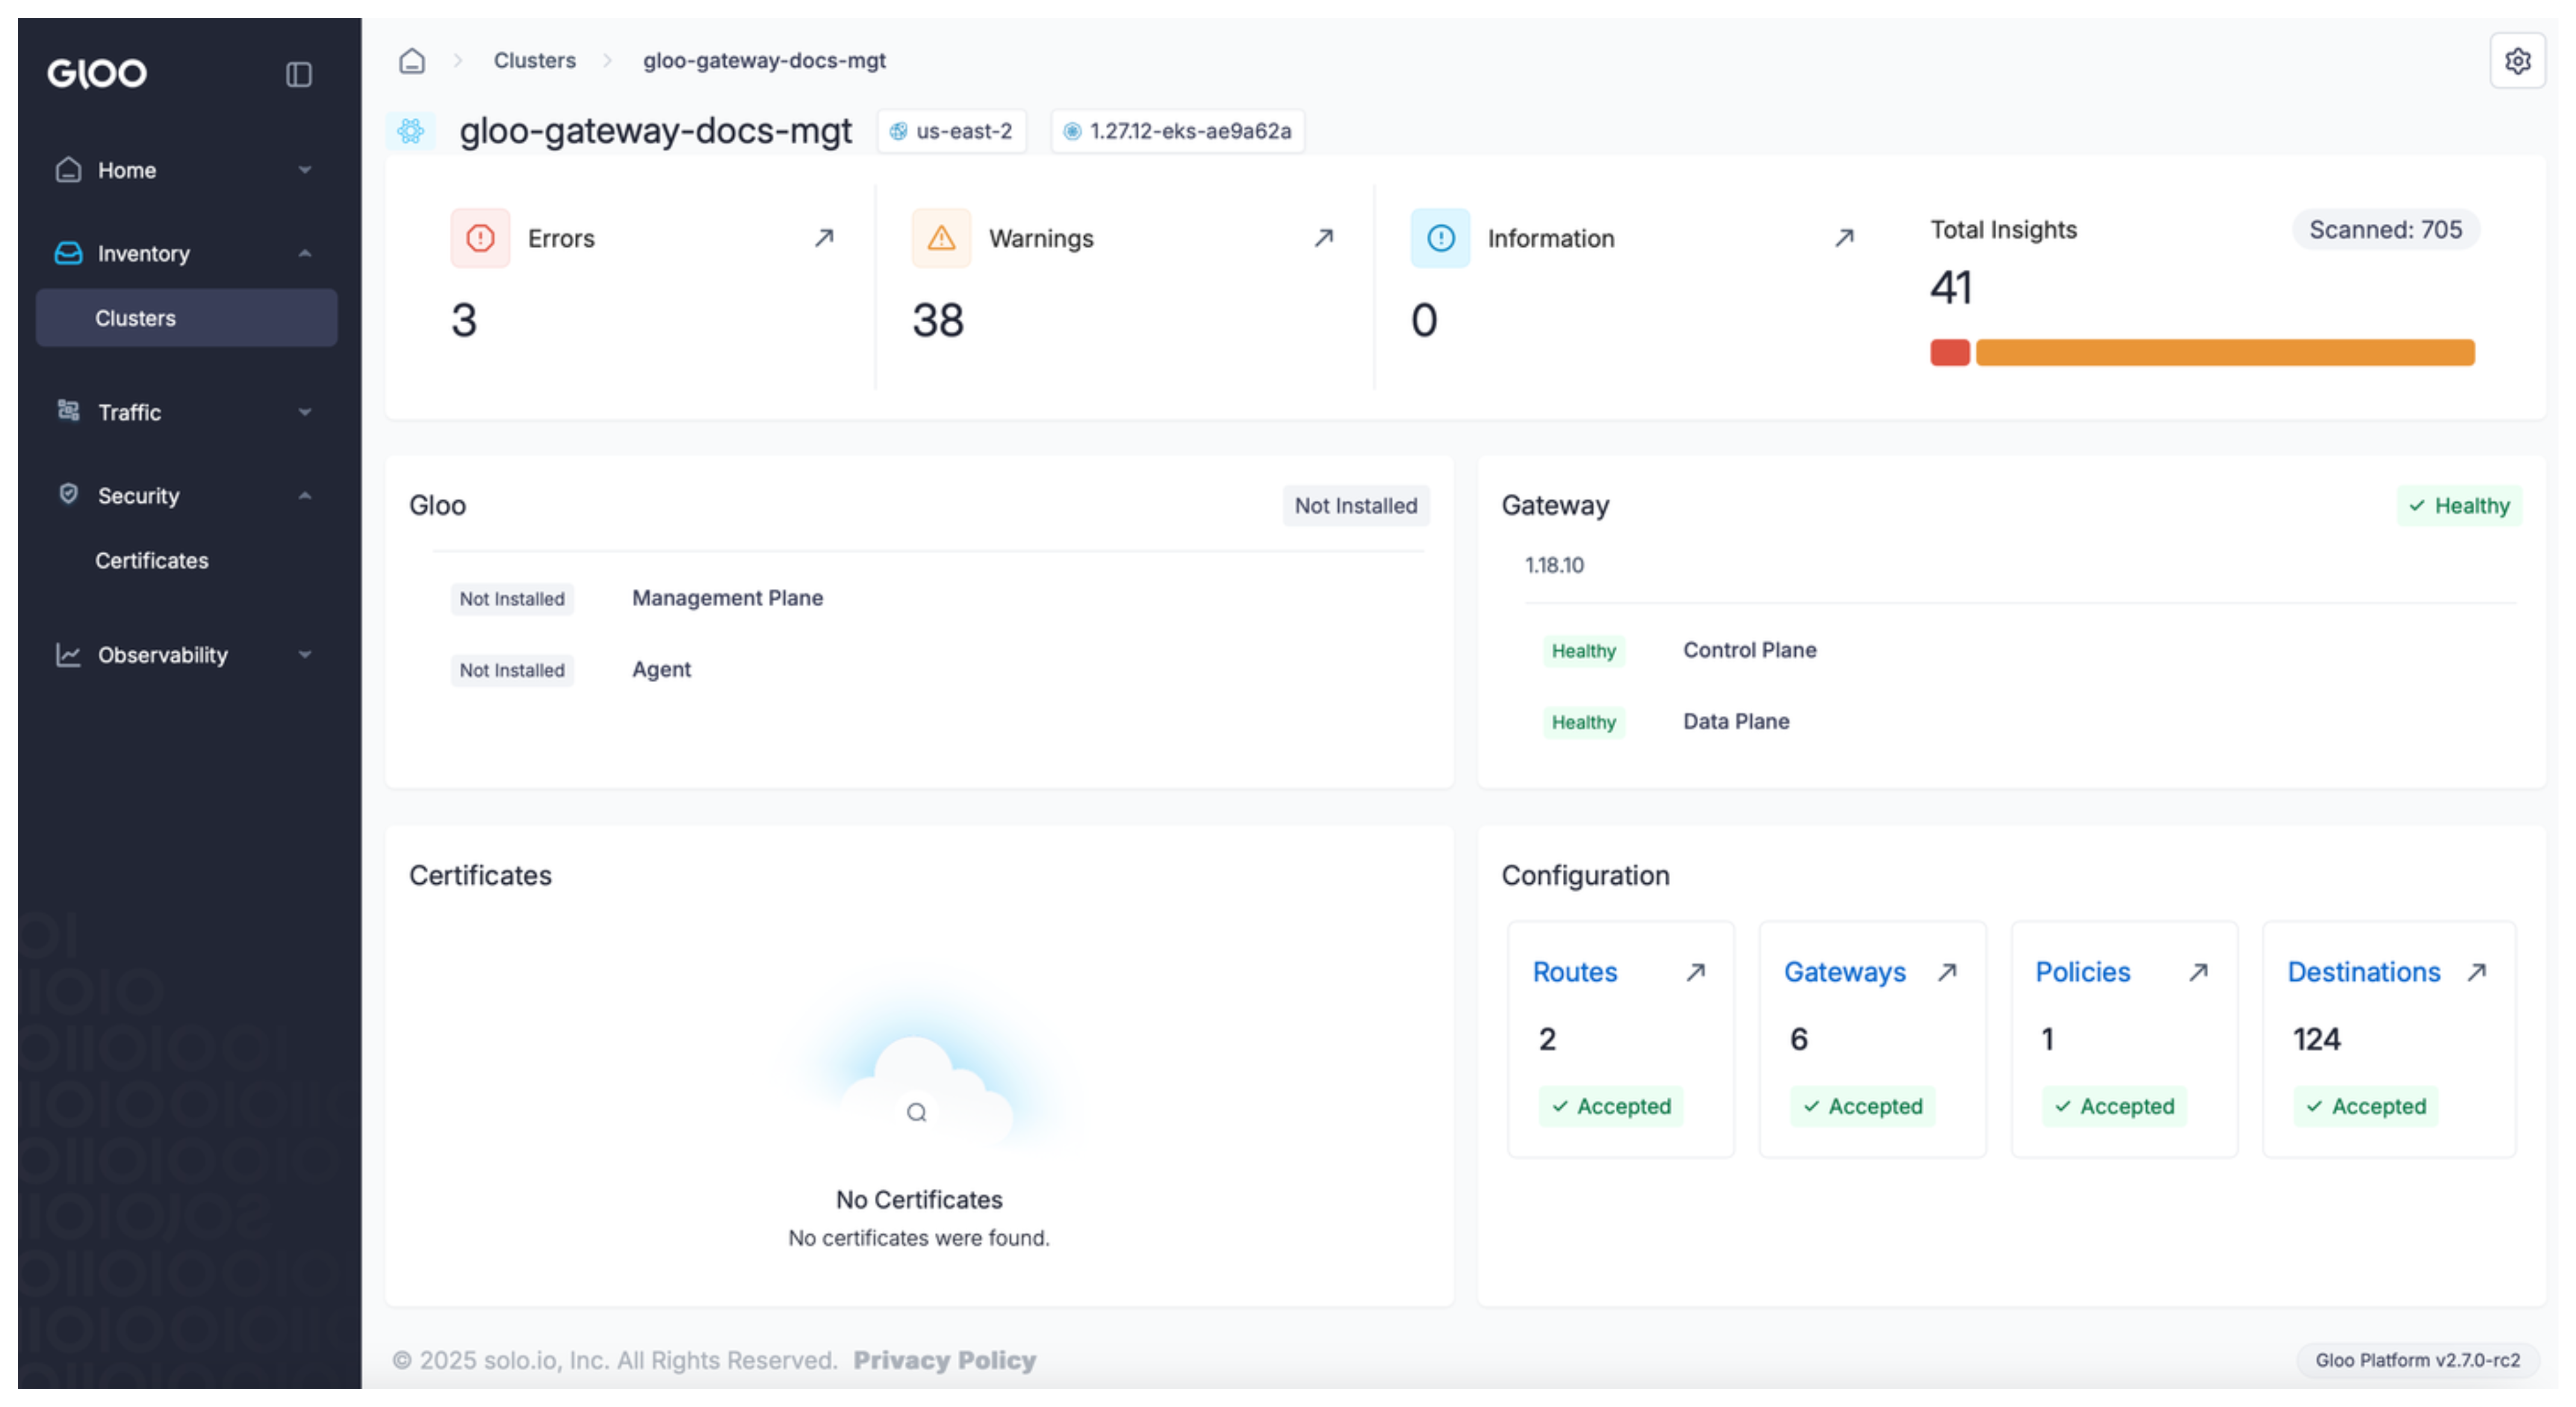
Clusters
On the Clusters page, review details of the cluster where Gloo Gateway is installed, such as insights, the health of the Gloo Gateway control and data planes, and applied routes, gateways, destinations, and policies.
Traffic
The Traffic section provides an overview of deployed Gateways, routes, policies, and destinations.
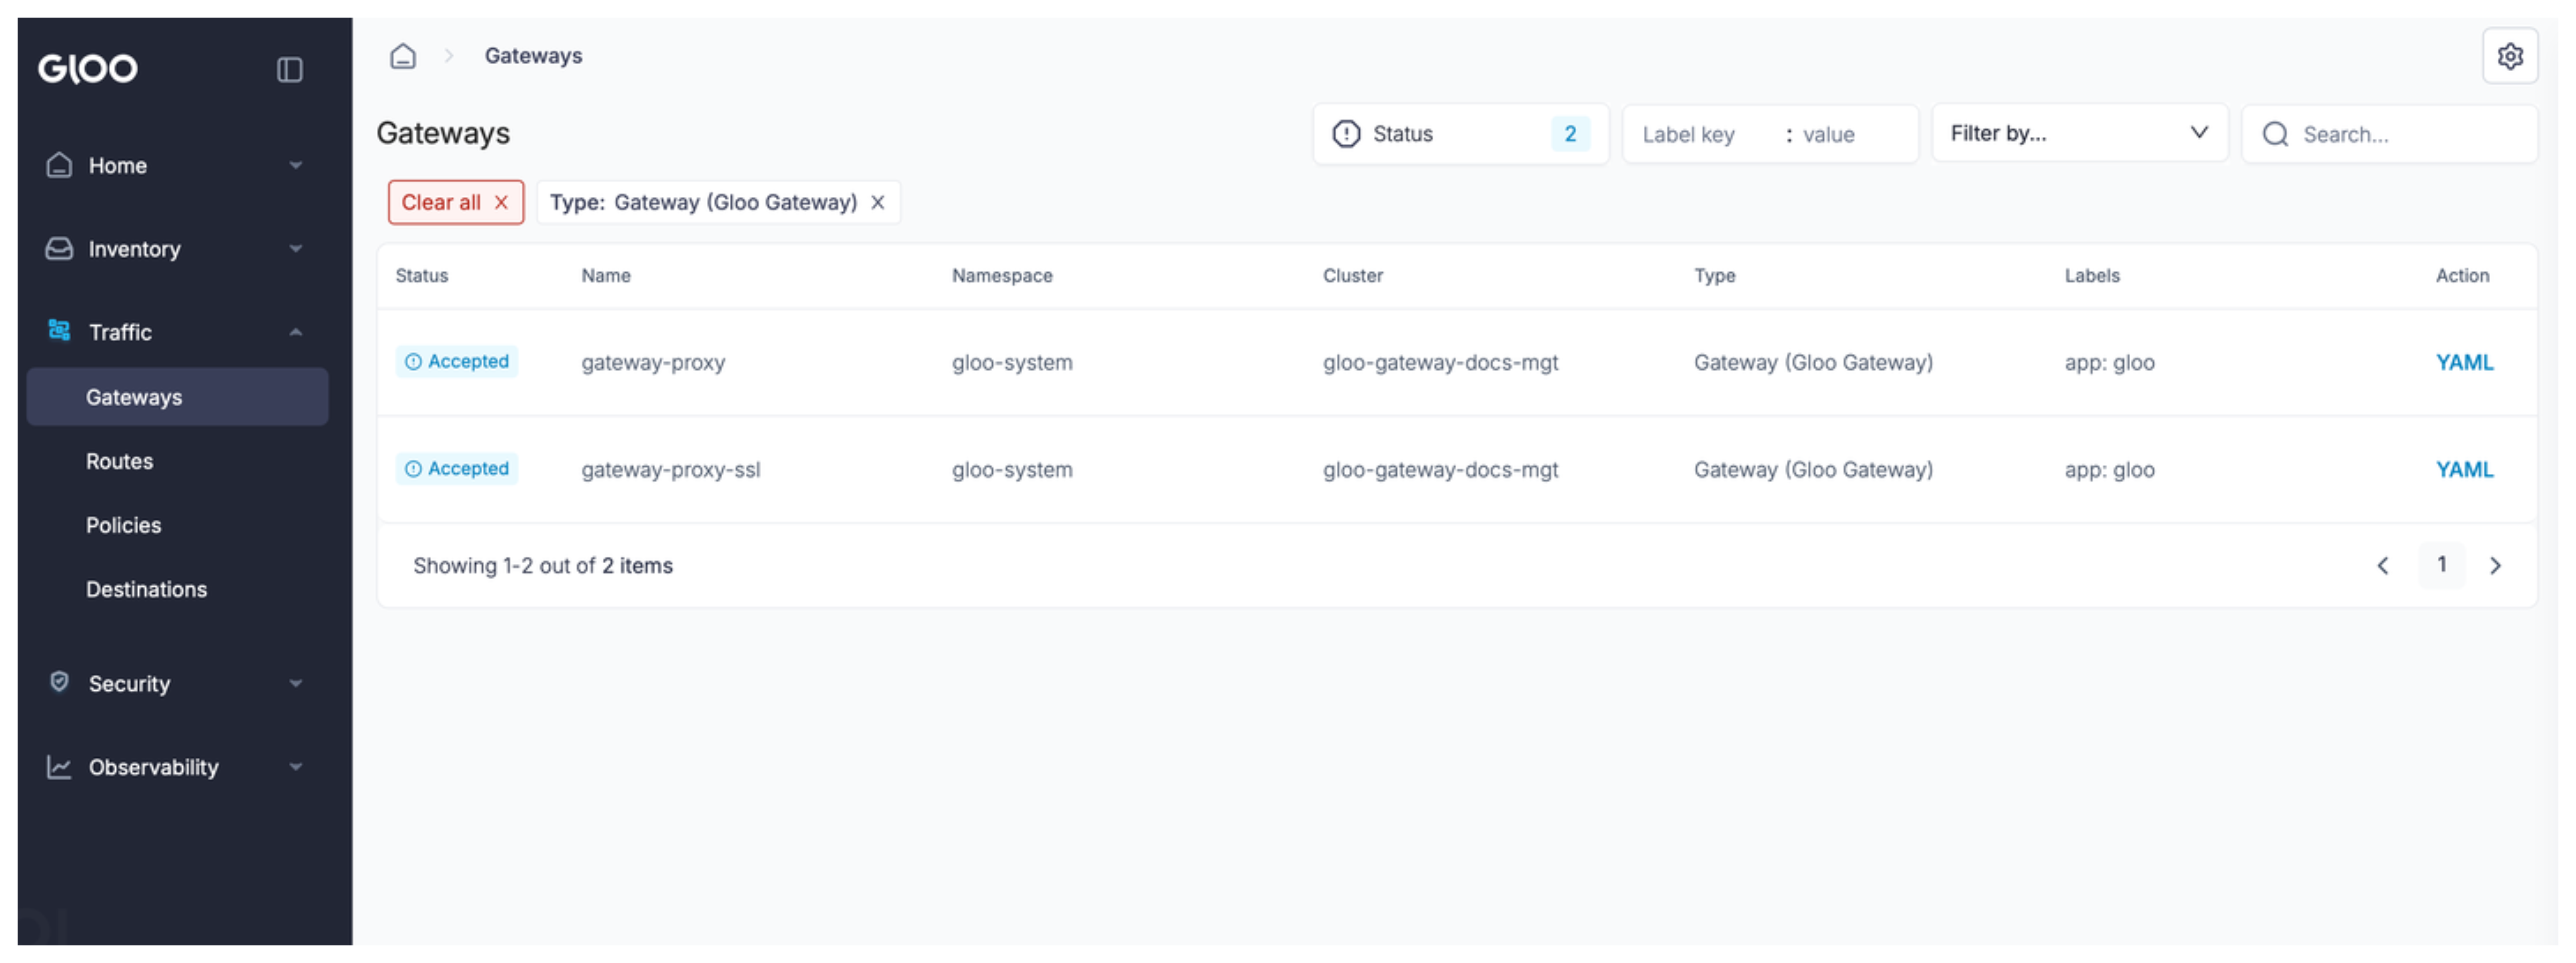
Gateways
On the Gateways page, you can view the YAML configuration of gateway-related resources, such as gateway proxies, or MatchableHTTPGateways and MatchableTCPGateways.
To filter the list of resources, you can choose between the following options:
- Use the Status field to filter between healthy and unhealthy gateway resources.
- Use the Label key and value fields to filter resources by their labels.
- Use the Filter by dropdown list to display the resource types that you are interested in.
- Use the Search bar to find a resource by name, namespace, or other properties
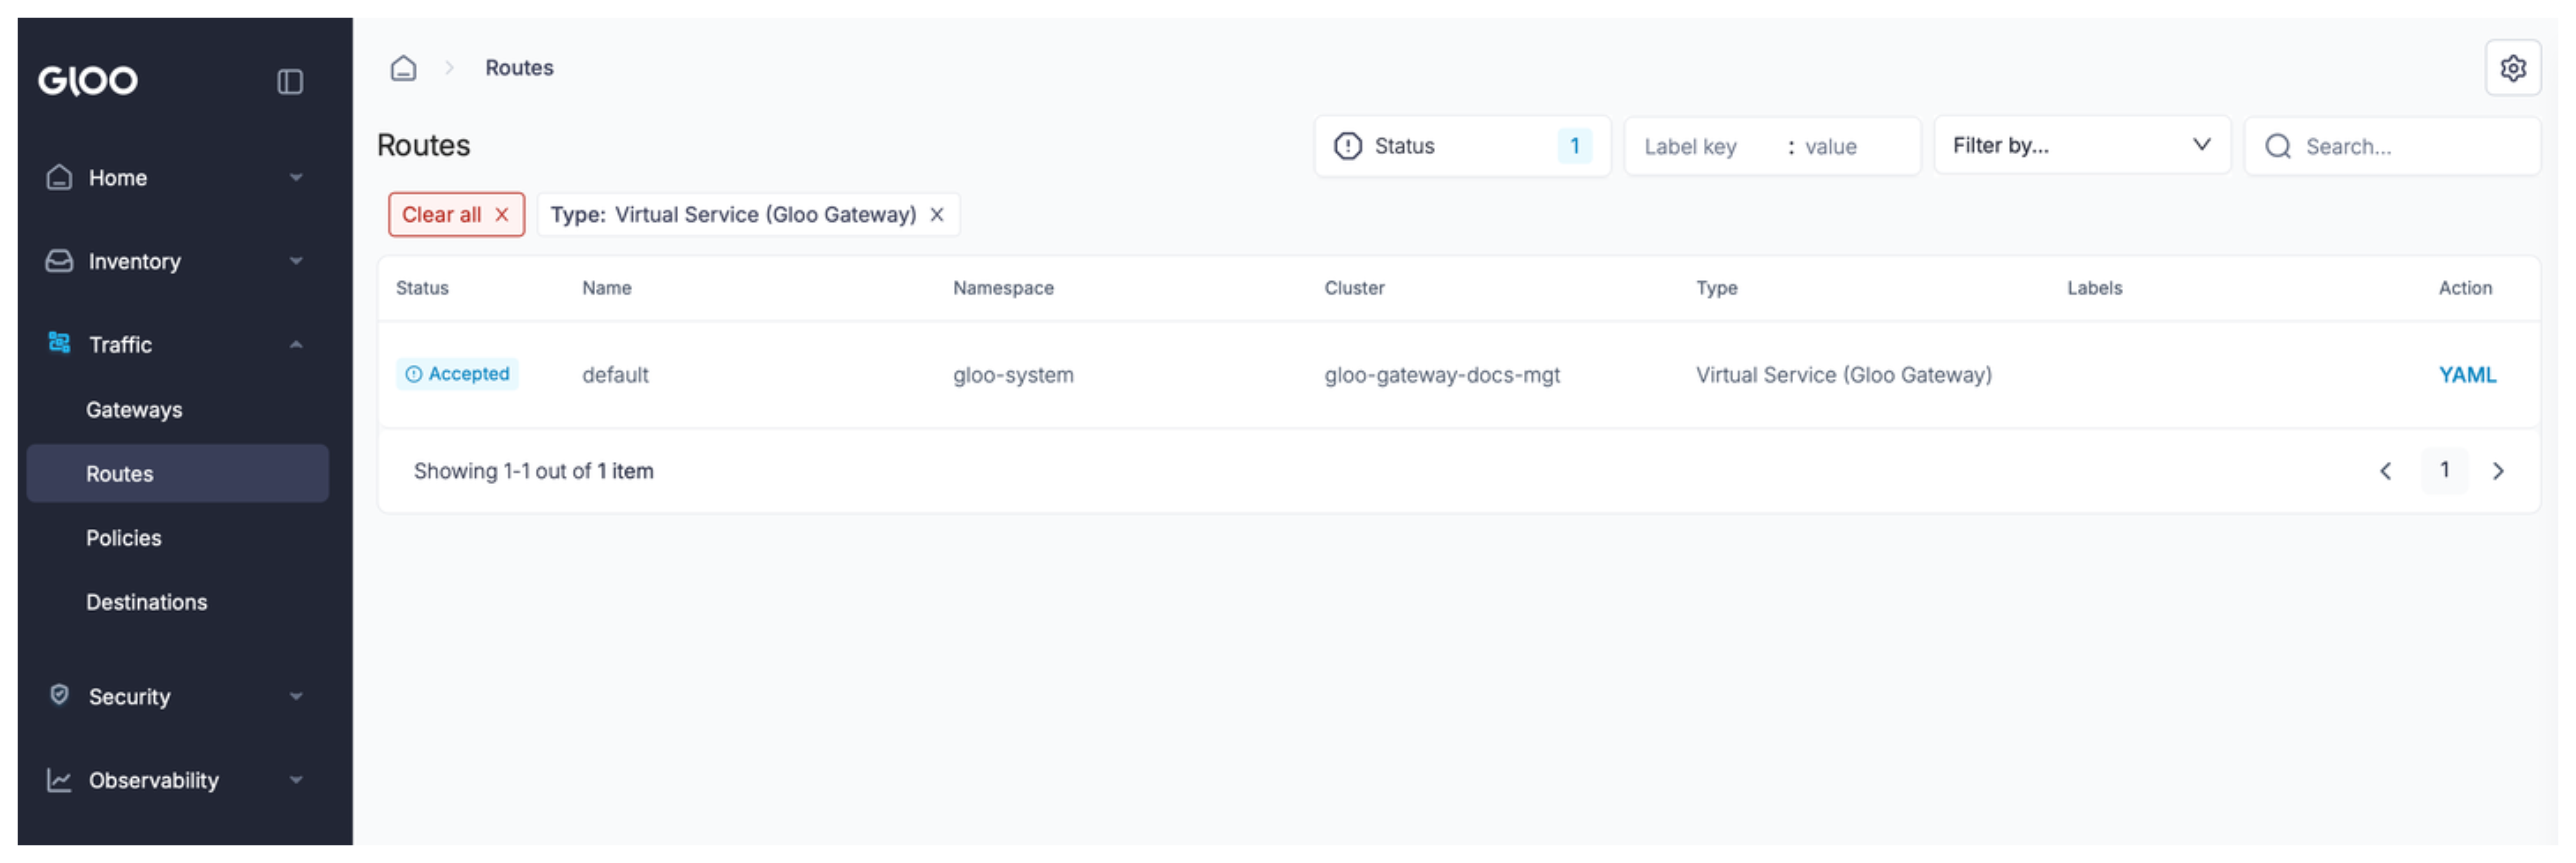
Routes
On the Routes page, you can view the VirtualServices and RouteTables that you created in your cluster. Click YAML to view the YAML configuration of your route.
To filter the list of resources, you can choose between the following options:
- Use the Status field to filter between healthy and unhealthy gateway resources.
- Use the Label key and value fields to filter resources by their labels.
- Use the Filter by dropdown list to display the resource types that you are interested in.
- Use the Search bar to find a resource by name, namespace, or other properties
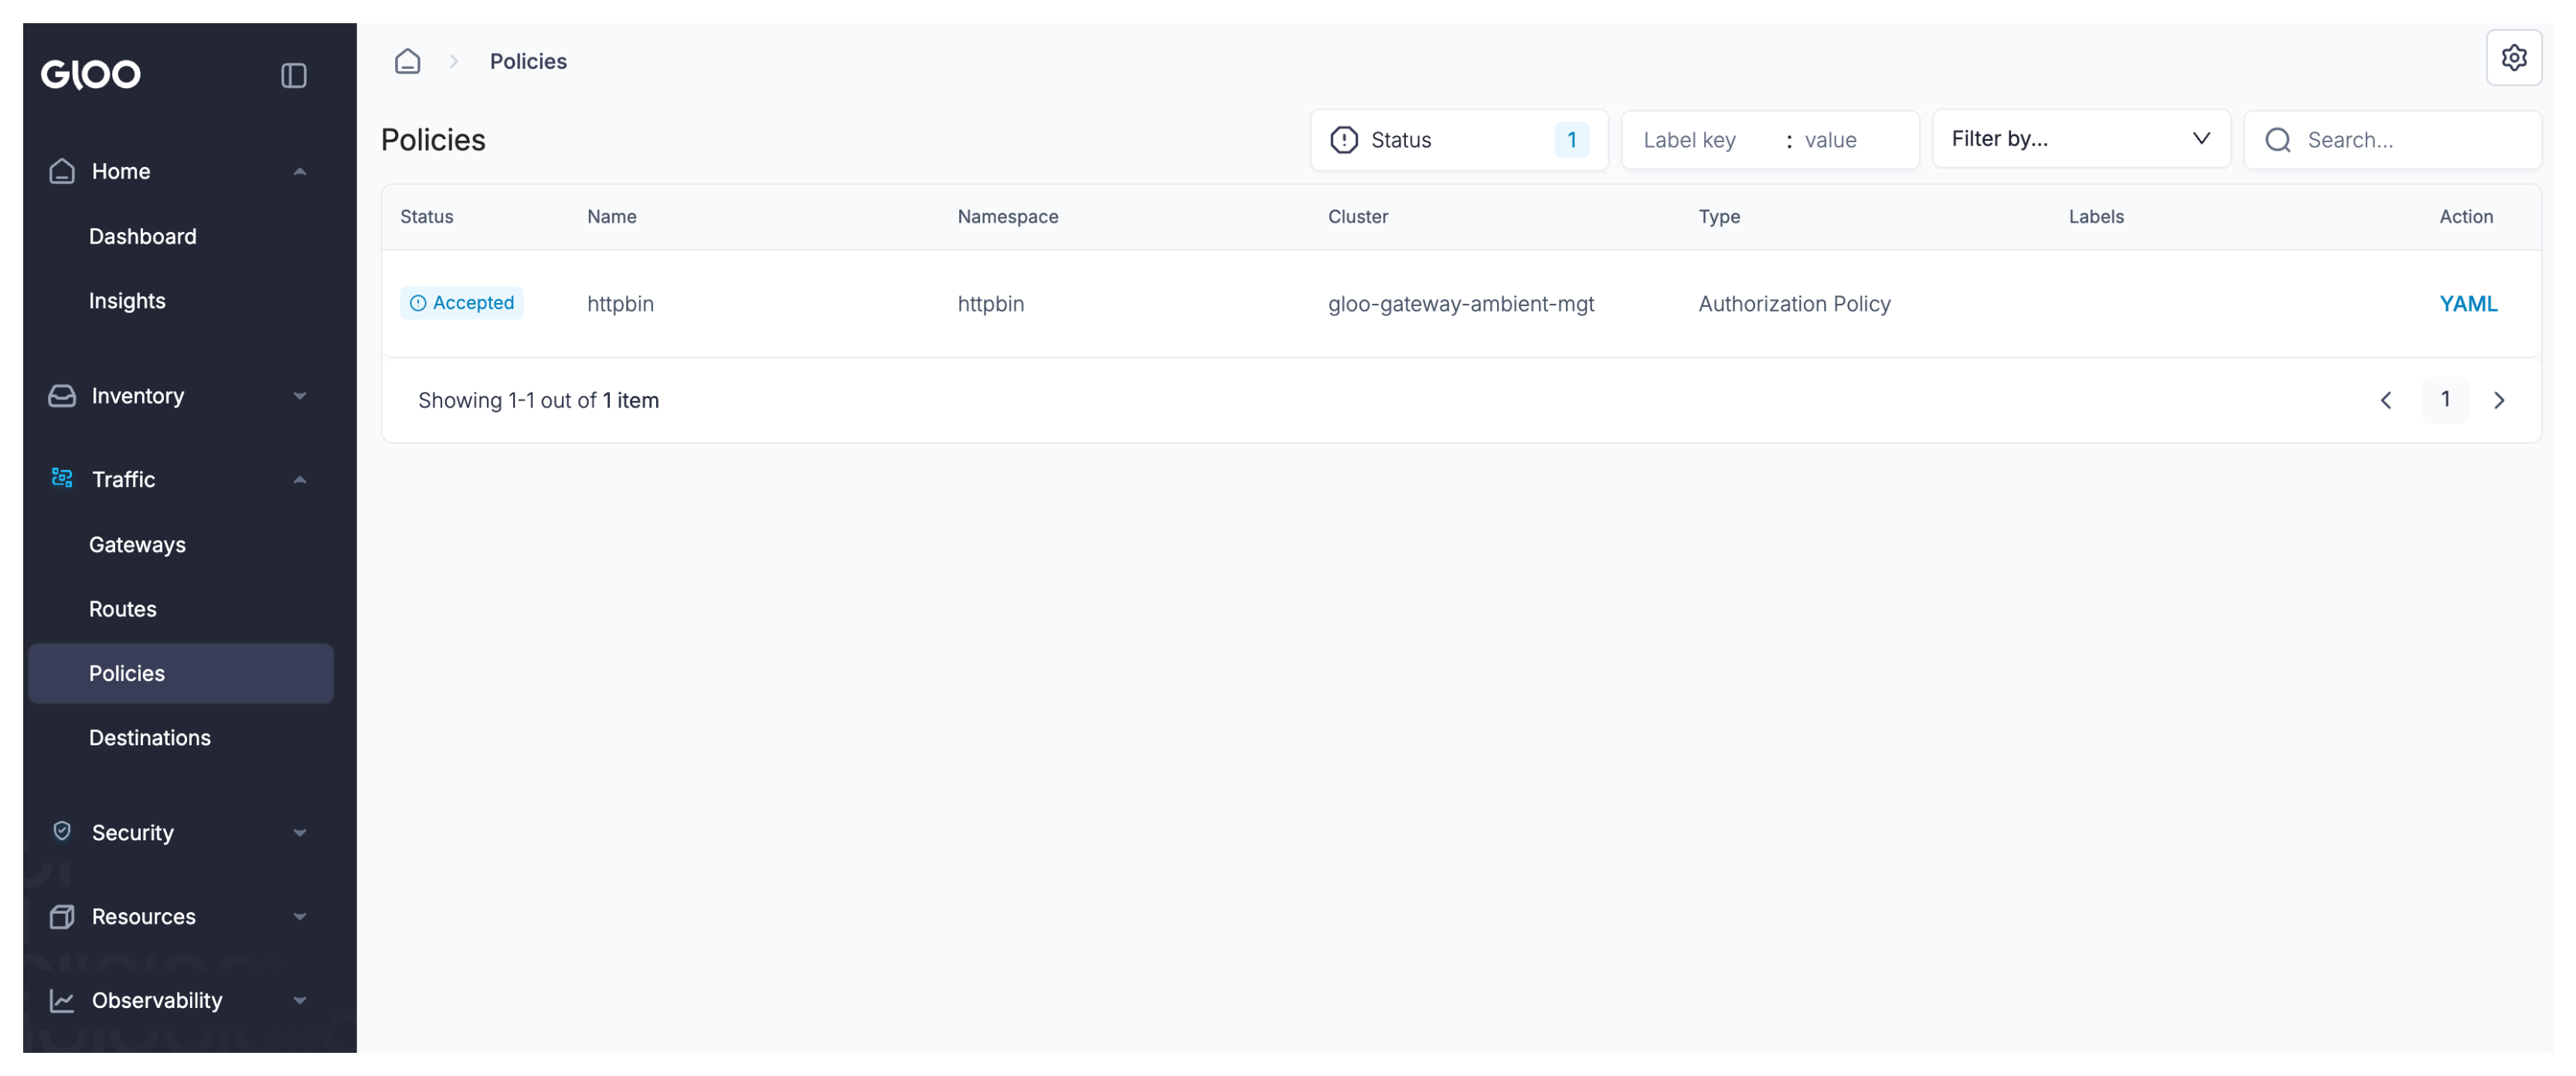
Policies
On the Policies page, you can view any policies that you applied in your environment, such as RouteOption, VirtualHostOption, ListenerOption, HttpListenerOptions, AuthConfigs, and RatelimitConfi. To view the policy configuration, you can click YAML.
To filter the list of resources, you can choose between the following options:
- Use the Status field to filter between healthy and unhealthy gateway resources.
- Use the Label key and value fields to filter resources by their labels.
- Use the Filter by dropdown list to display the resource types that you are interested in.
- Use the Search bar to find a resource by name, namespace, or other properties
Destinations
On the Destination page, review a list of discovered destinations, such as Kubernetes services and Gloo Gateway Upstreams.
To filter the list of resources, you can choose between the following options:
- Use the Status field to filter between healthy and unhealthy gateway resources.
- Use the Label key and value fields to filter resources by their labels.
- Use the Filter by dropdown list to display the resource types that you are interested in.
- Use the Search bar to find a resource by name, namespace, or other properties
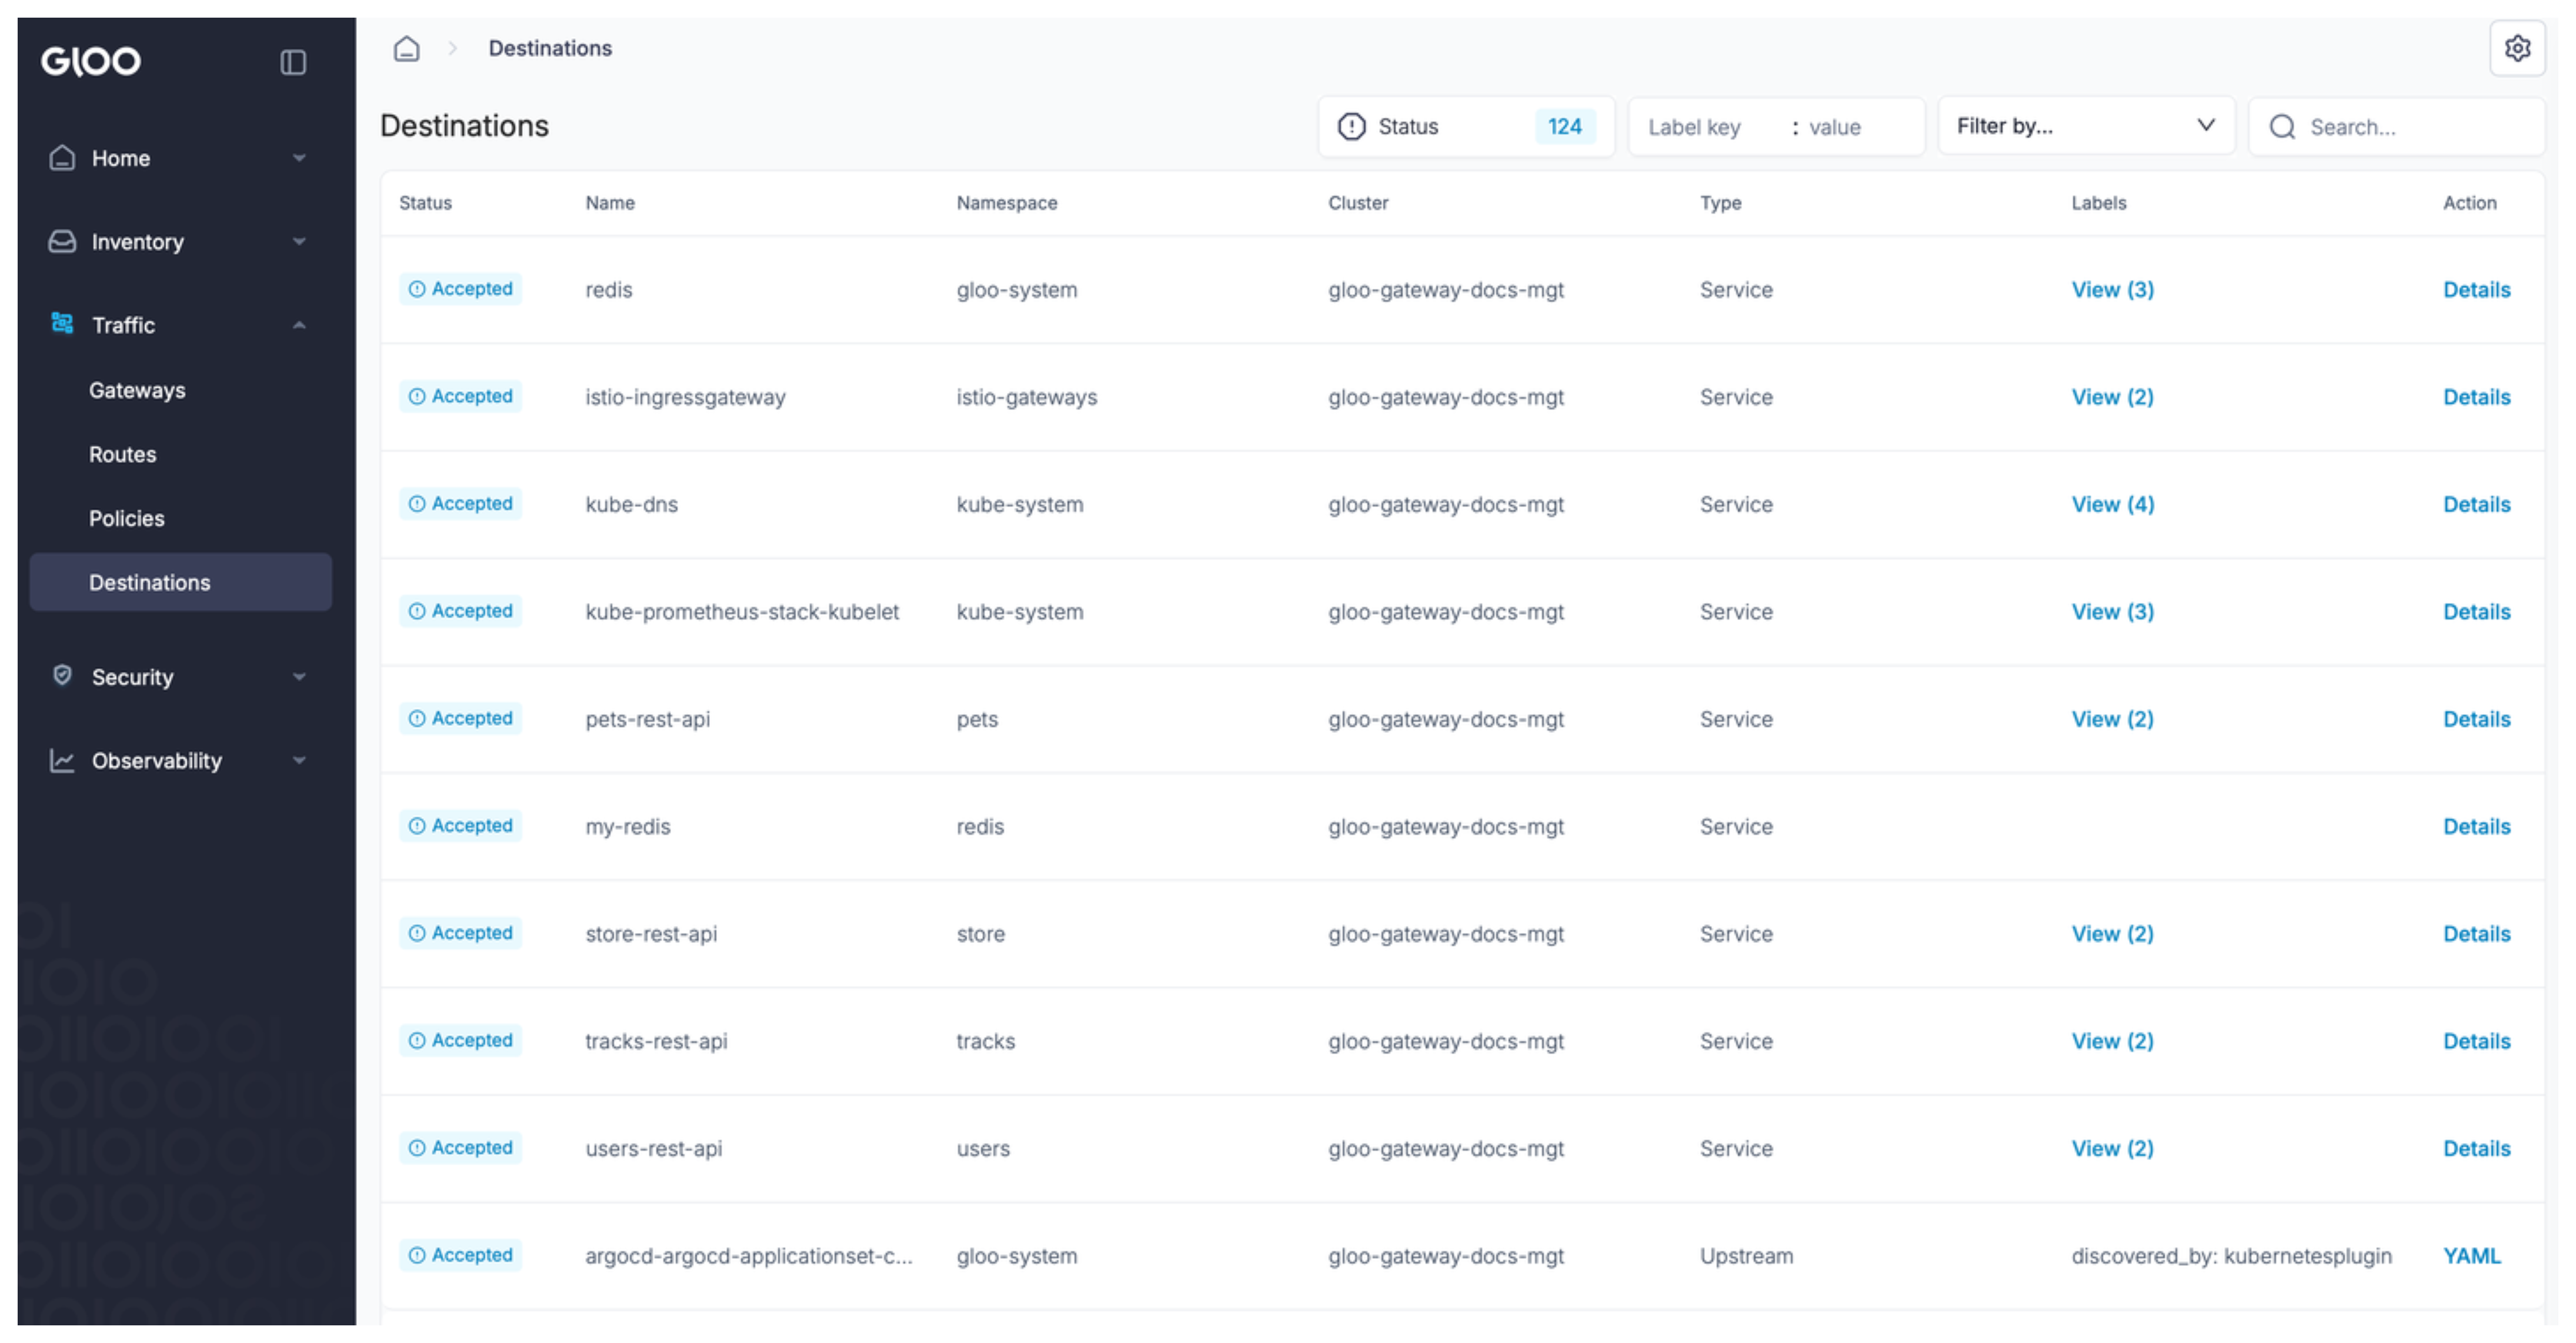
For Kubernetes services, you click on Details to perform the following tasks:
- Review the destination’s configuration with the YAML button. The YAML details can help you debug the service.
- See an analysis of the service’s error rate and latency in the Service Signals card.
- View the Graph tab to visualize the network traffic that reaches your destination. For more information about how to use the graph, see Graph.
Security
Review details of the security setup of your Gloo Gateway environment.
Certificates
This view is not supported when using Gloo Gateway with the Gloo Edge API. It is supported only for setups that use the Kubernetes Gateway API. For more information, see Certificates in the Gloo Gateway (Kubernetes Gateway API) documentation.
Observability
Visualize traffic in the Gloo UI.
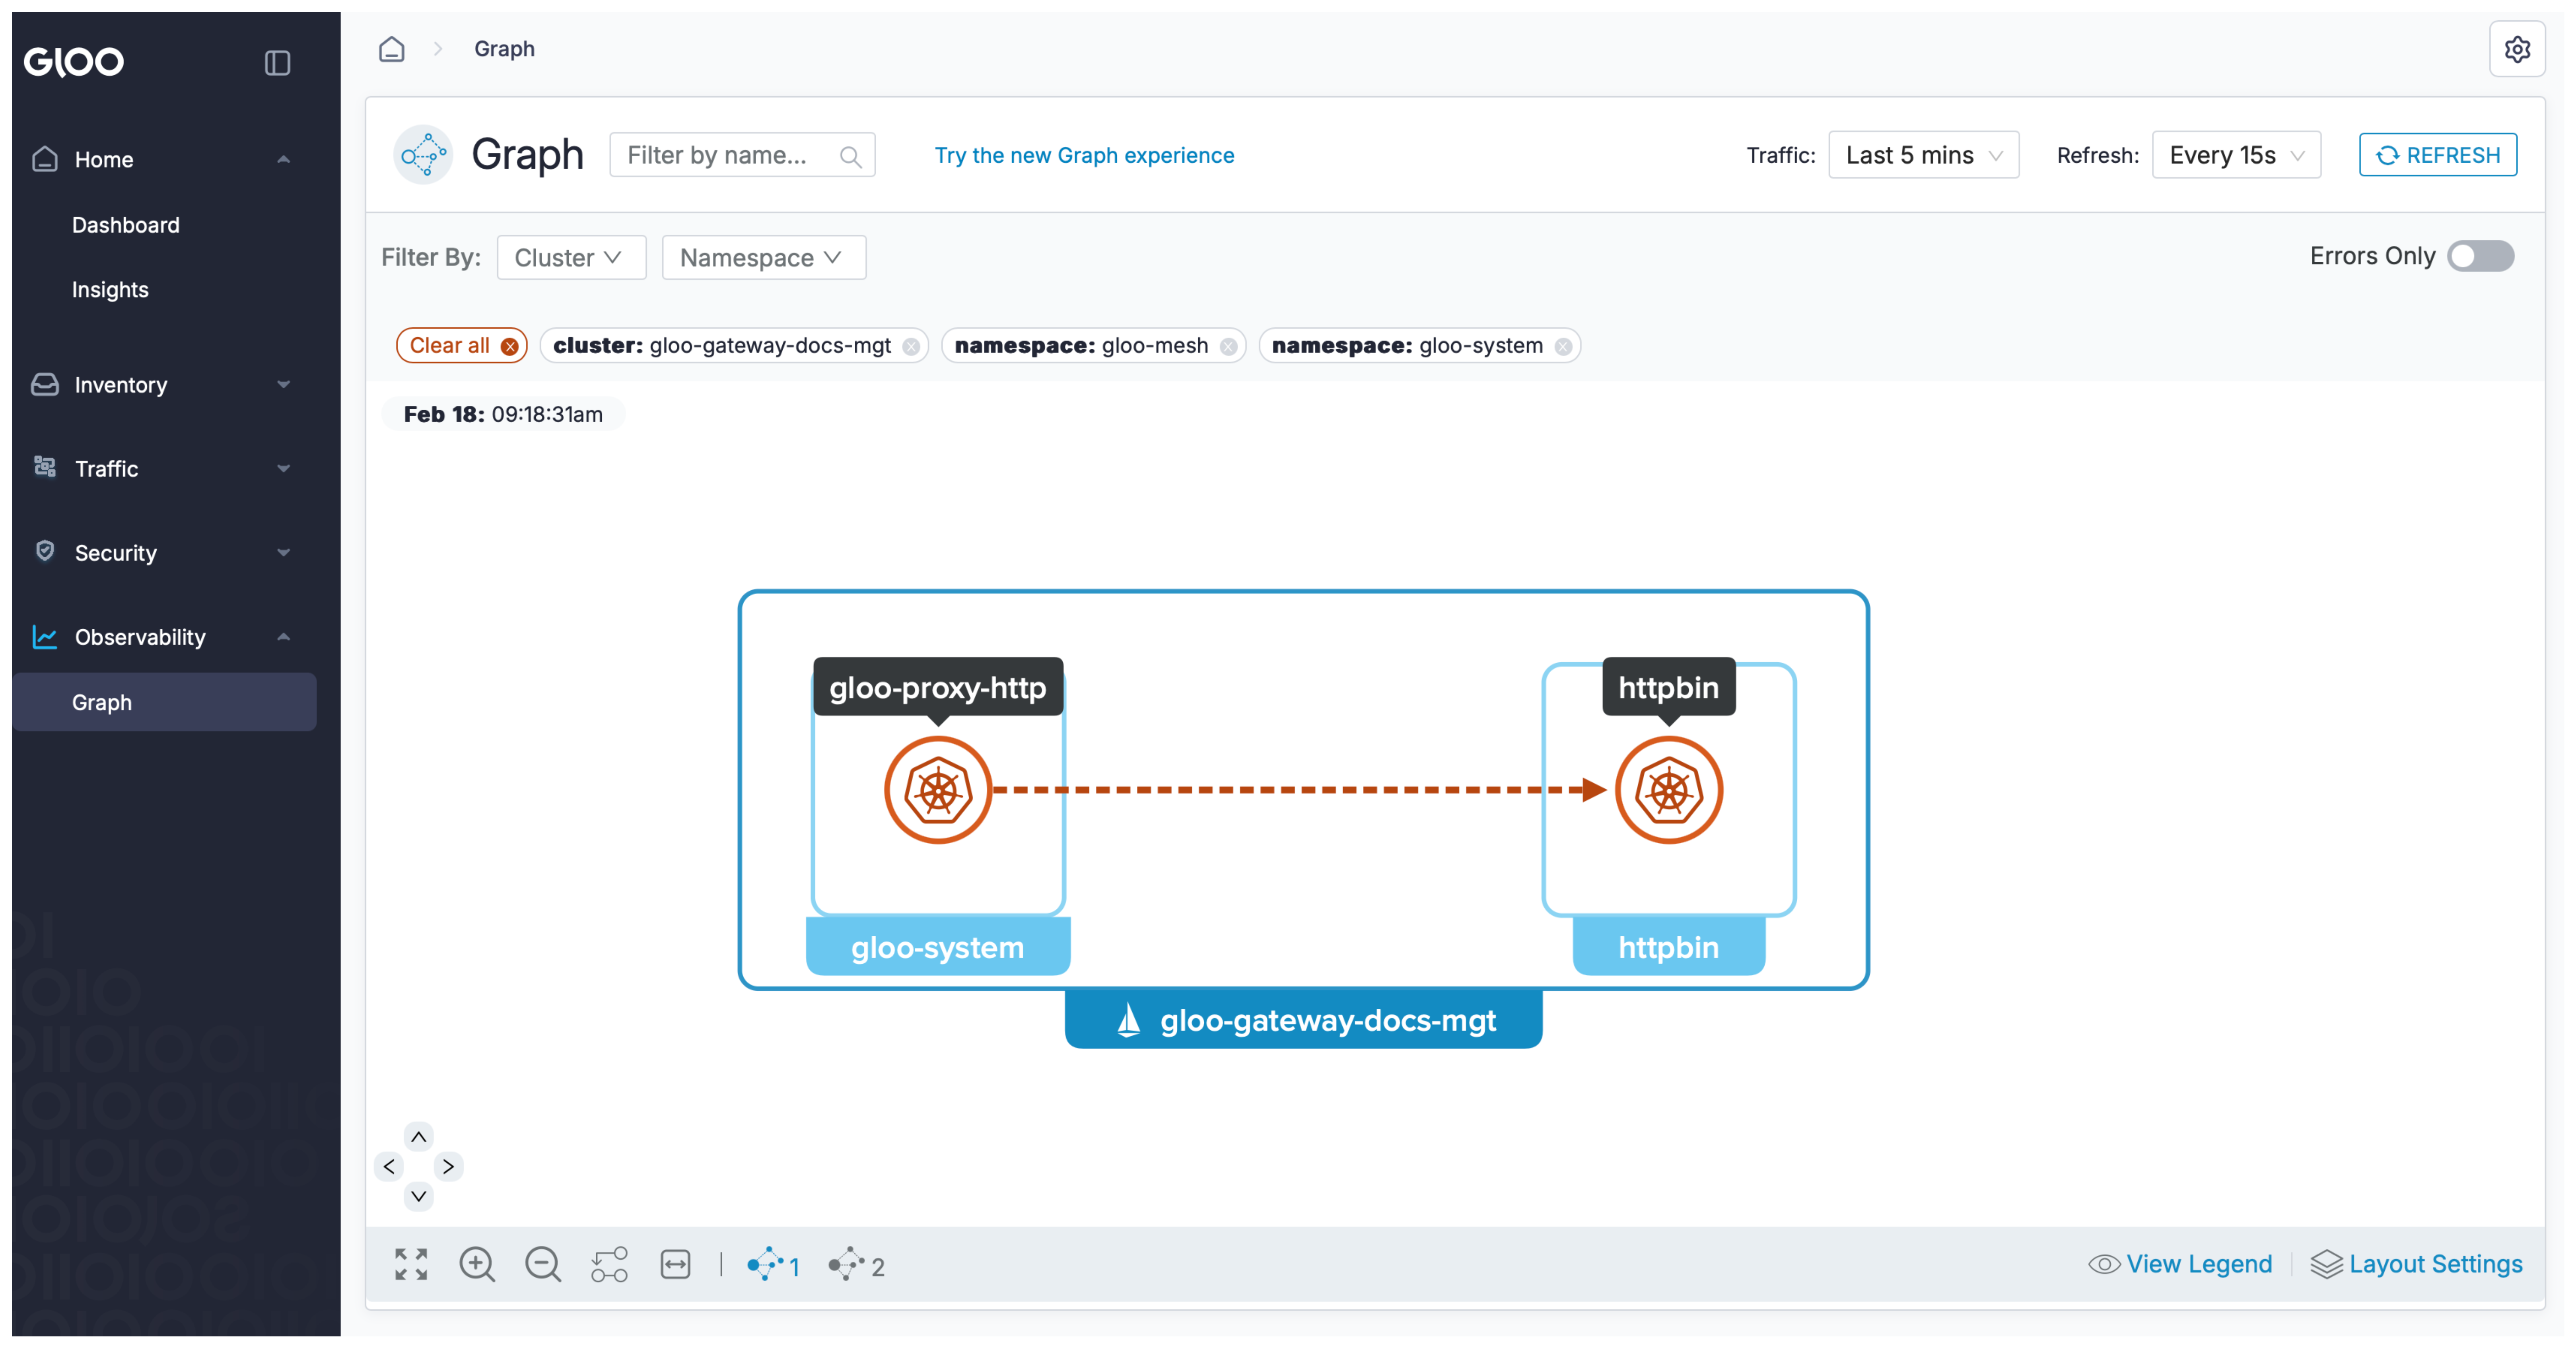
Graph
The Gloo UI Graph visualizes traffic in your cluster and is available only for gateways that use the Kubernetes Gateway API. Gateways that use the Gloo Edge API are not supported. To learn more about the Graph and how you can visualize traffic in your cluster, see Graph in the Gloo Gateway (Kubernetes Gateway API) documentation.